Dallas, TX
healthcare software · dallas

Healthcare Reporting and Dashboards That Every Clinic Counts the Same Way

When each clinic counts a no-show or an open referral differently, the monthly report starts arguments. Oak Cliff Software builds healthcare reporting and dashboards for Dallas–Fort Worth groups that define each metric once and compare locations fairly.

3 min read · 4 sections · 4 answers

One set of numbers

Metrics defined once.

Earlier action

Backlogs show while there is time.

Fair comparisons

Every clinic counts the same way.

Right access

Views by role and location.

Dashboards pull from the EHR, scheduling, referral and billing tools you already use, where they allow it. They are fully HIPAA compliant, with access by role.

01

Definitions first

Before any chart, we write down what counts as a no-show, a completed referral, an open authorization and a backlog, and who owns each definition. Every location then counts the same way.

  • Scheduling and no-shows
  • Referral and authorization backlog
  • Intake completeness
  • Wait times by location
02

Backlogs while there is still time

Administrators see a backlog forming this week, not in next month's report. Each number opens the records behind it, so a manager can act on it directly.

// how healthcare reporting & dashboards flows
  1. 1 Activity recorded
  2. 2 Metric rules applied
  3. 3 Views refresh
  4. 4 Stalls flagged
  5. 5 Owner follows up
03

Fair comparison across clinics

Groups with clinics in Fort Worth, Arlington and Frisco see every site on the same scale, with notes for real differences such as hours or specialty mix.

TodayWith healthcare reporting & dashboards

✕Reports rebuilt every month

✓Dashboards refreshed automatically

✕Each clinic counts differently

✓Shared written definitions

✕Backlogs found too late

✓Backlogs visible this week

04

Access by role

Front desk leads see their office, managers see their region and leadership sees the group. Access follows your policy and every view is logged.

The system handles

  • Pulling activity from connected systems
  • Flagging items past target
  • Sending the weekly digest

Your people decide

  • Agreeing on targets
  • Clearing bottlenecks
  • Explaining what a trend means
your first release

What a first healthcare reporting & dashboards release includes

A focused starting point, shaped with your team in Discovery and adjusted to how your Dallas team works. Then we build on it.

  1. Discover
  2. Design
  3. Build
  4. Launch
  5. Optimize
Plan your first release →
release planHealthcare Reporting & Dashboards · v1.0Ready to scope
  • Metric definition book01
  • Location dashboards02
  • Backlog and drill-down views03
  • Source connections04
  • Role-based access05
  • Handover runbook and owner register06
Then: connect more tools, add automation and AI as your team is ready.
in practice

What healthcare reporting & dashboards looks like day to day

Illustrative scenarios, not client stories.

A group with clinics across Tarrant County

Picture managers who rebuild a spreadsheet every Monday. Dashboards refresh on their own, and each clinic's no-show rate is calculated the same way.

Build something like this →Every system is shaped around your own process.
faq

Healthcare Reporting & Dashboards: questions we hear

Still unsure? Ask us directly.

Is it HIPAA compliant?

Yes. It is built for full HIPAA compliance: encryption, multi-factor sign-in, role-based access, audit trails, a HIPAA-trained team member on the project and a signed BAA.

Where does the data come from?

From your EHR, scheduling, referral and billing tools, connected where they allow it.

Can each clinic see only its own data?

Yes. Access is set by role and location.

Who owns the software?

You do. The code, the data and the documentation are yours after launch.

often built together

Healthcare Reporting & Dashboards works best connected

Most teams start with one system and connect the next when they are ready. These are the services most often built alongside healthcare reporting & dashboards, on the same record.

All services →
built by our team

See the pattern in a real system

Recruiting, training, contracts and commissions in one sales platform, where a signed and paid deal starts delivery.

All highlighted work →
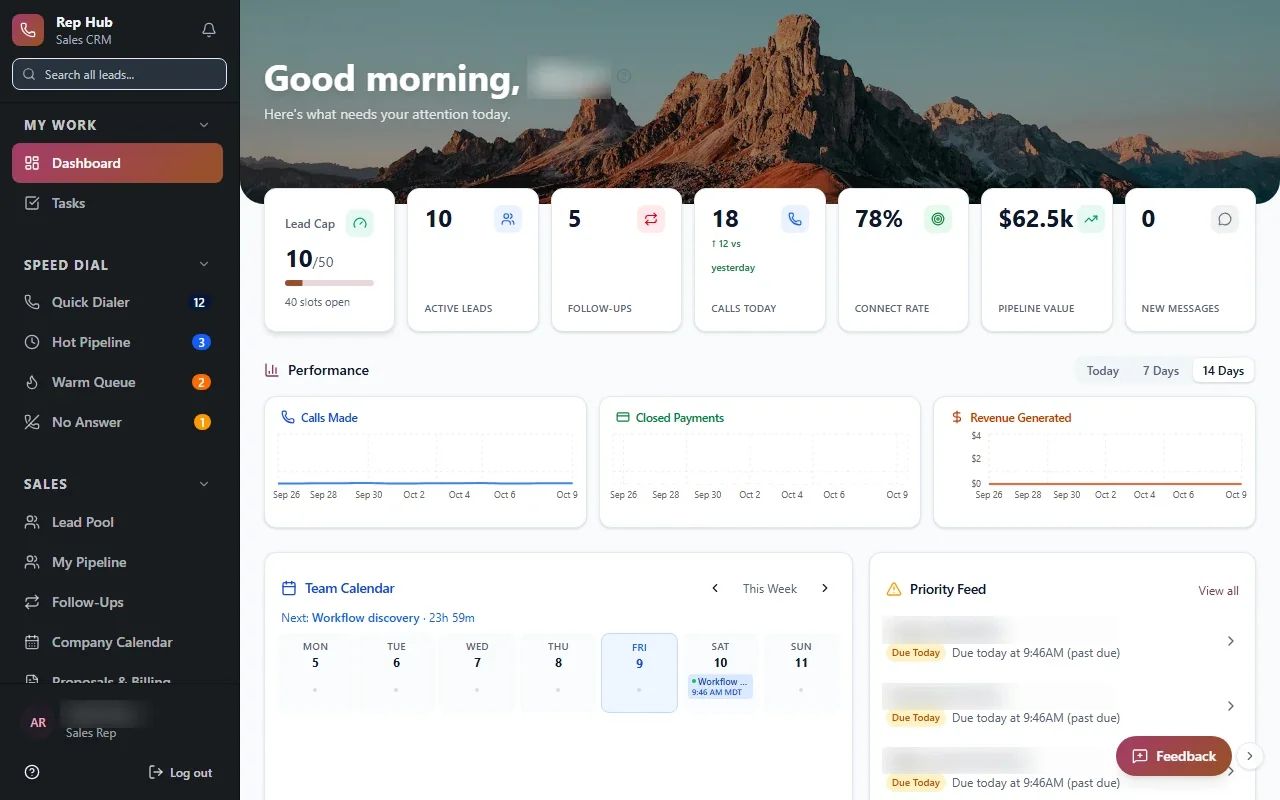
Rep HubRep Hub sales dashboard with lead pipeline, team performance, calendar and tasks Built · Sales organizationRep HubFrom joining the sales team to delivering the sale, in one connected platform.View the project →

Start with the problem. We'll build the possibility.

Tell us what slows your team down. We'll map it with you and suggest a useful first release, whether you're in Dallas or anywhere in Dallas–Fort Worth.