
Dallas, TX
core service · dallas

Internal tools in Dallas that give every location the same clear picture

Ask an operations leader with offices in Plano, Las Colinas and Fort Worth how last week went, and you will often hear the same answer: give me a day to pull it together. The data exists. It just lives in a scheduling system, an accounting export, a shared spreadsheet and someone's memory.

6 min read · 6 sections · 6 answers

One view, every site

Leaders compare locations on shared definitions without assembling a report by hand.

Numbers that lead somewhere

Every figure opens to the items behind it, with an owner and a next action.

Spreadsheets with guardrails

Admin screens keep the speed people like and add validation, history and permissions.

Access by location and role

Staff see their own site while leaders see across sites, under rules you control.

Oak Cliff Software builds internal tools for Dallas–Fort Worth businesses that need one shared view, with room for how each office works. That means simple screens for the daily tasks your staff do, and dashboards that do more than display numbers. Each figure links to the work behind it, so you can go from a problem to the person handling it.

01

Start with the questions you ask every week

Before we design a single chart, we ask your leadership team to list the questions they ask most. Not metrics. Questions. The list usually looks something like this:

Each question becomes a view. If a question cannot be answered from the data you capture today, that tells us what the first release needs to record. Good internal tools are designed backward from the decisions people make, not forward from whatever data happens to be available.

  • Which locations are behind, and on what?
  • What is waiting on us, and what is waiting on the customer?
  • Who is overloaded this week, and who has room?
  • Which problems are new, and which ones keep coming back?
02

A screen for the office, a view for the group

People at different levels need different things from the same information. A front desk lead in Richardson needs today's list for Richardson, in order, with the next action on each item. A regional manager needs to see all sites side by side and spot the one that is drifting.

We build both from the same records. Staff see their own location by default. Leaders see across sites and can open any one of them. Access rules are set per location, so a site manager in Denton does not see pay details for McKinney unless their role calls for it.

This is what a multi-location dashboard should be: one set of data, many views, and nobody keeping a private copy to feel in control. When internal tools for Dallas teams are built this way, the weekly report stops being a project.

// how internal tools & dashboards flows
  1. 1 Work happens
  2. 2 Data is recorded once
  3. 3 Definitions applied
  4. 4 Dashboard updates
  5. 5 Team acts
03

The admin screens your staff open first thing in the morning

Dashboards get the attention, but the most valuable screens are often plain. A screen to check in equipment. A form to log a site visit that fills in what it already knows. A list of open requests that a coordinator works through from top to bottom.

These admin tools replace the fragile spreadsheets that hold a business together: the one with color codes only one person understands, the one that breaks when someone sorts the wrong column. We keep what works about the spreadsheet, such as speed and familiarity, and add what it lacks: validation, history, permissions and a record of who changed what.

An admin dashboard built for one job beats a general tool with every feature turned on. We would rather ship a narrow screen your team uses every day than a broad one they avoid.

TodayWith internal tools & dashboards

✕Weekly reports assembled by hand from several exports

✓Views update as work is recorded at each location

✕Each office defines late or complete its own way

✓Shared definitions apply at every site, written in plain English

✕A color-coded spreadsheet only one person understands

✓A simple admin screen with history and permissions

✕Dashboards show a red number and stop there

✓Each number opens to the items, owners and next steps

✕Staff juggle several tabs to answer one question

✓One screen answers it, with the actions right beside it

04

When late means the same thing in every office

Ask three offices what counts as a late job and you may get three answers. One counts from the promised date, one from the scheduled date, one from when the customer called to complain. Put those numbers on the same chart and the comparison means nothing.

Part of every project is agreeing the definitions with your team and writing them down. Late, open, complete, no-show, at risk: each one gets a plain-language rule that applies at every site. Local settings still exist, such as office hours or service areas, but the definitions are shared.

This is the unglamorous work that makes an operations dashboard trustworthy. It is also why DFW groups that buy generic internal tools often end up exporting everything to a spreadsheet anyway: the tool counted things its own way. Once leaders believe the numbers, they stop asking for the spreadsheet behind them.

05

From a number to the person who can fix it

A chart that shows overdue items is a start. The useful part is clicking that number and seeing which items, at which locations, who owns each one, and what is blocking it.

That is the pattern behind our Industrial Operations Platform. Leadership sees exceptions such as a quote about to expire, material running late or a site not ready for install, each with an owner and a next action. Nobody has to call around to find out what the red number means.

Internal tools built this way let people act where they see the problem: reassign, approve, add a note or follow up. Analysis tools are still useful for longer questions. Daily operations need a screen that ends in a next step.

The system handles

  • Collecting and combining data
  • Flagging overdue and blocked items
  • Scheduled report delivery

Your people decide

  • Deciding priorities
  • Following up on exceptions
  • Setting targets
06

Built with the people who will use it

We follow the same process on every project: Discover, Design, Build, Launch, Optimize. For internal tools in Dallas offices, the most important part happens during Build, when your staff see and test working screens on their own data.

We start with a focused first release, often one view and one admin screen, and pilot it at a single location. The people at that site tell us what slows them down. We fix it, then roll it out to the next location with its own settings.

We pull data from the systems you already use, where the vendor's APIs or integration options allow. You own the code and the data. If a tool you already pay for answers a question well, we leave it in place.
your first release

What a first internal tools & dashboards release includes

A focused starting point, shaped with your team in Discovery and adjusted to how your Dallas team works. Then we build on it.

  1. Discover
  2. Design
  3. Build
  4. Launch
  5. Optimize
Plan your first release →
release planInternal Tools & Dashboards · v1.0Ready to scope
  • Agreed definitions for your key operational terms01
  • One admin screen replacing a critical spreadsheet02
  • A daily exceptions list for each location03
  • A cross-site leadership view with drill-down04
  • Access rules set by location and role05
  • Data connections where your current systems allow06
Then: connect more tools, add automation and AI as your team is ready.
in practice

What internal tools & dashboards looks like day to day

Illustrative scenarios, not client stories.

Daily exceptions for a therapy group

Example: a therapy group with clinics in Arlington and Grand Prairie wants each front desk to start the day with a short list: unconfirmed appointments, missing intake forms and authorizations close to expiring. The clinic director sees the same lists for every site. The tool is built for HIPAA-regulated workflows, with access limited to each person's location and role.

Build something like this →Every system is shaped around your own process.
faq

Internal Tools & Dashboards: questions we hear

Still unsure? Ask us directly.

What kinds of internal tools do Dallas businesses usually start with?

Most start with one admin screen that replaces a fragile spreadsheet, plus one view that answers a question leaders ask every week. Common examples are a request queue, an equipment or job tracker, and a daily exceptions list. Starting narrow means people use it right away, and the first release shows what to build next.

How is this different from a business intelligence tool?

Business intelligence tools are good for analysis and longer questions. What we build also lets people act: assign, approve, fix and follow up from the same screen where they spotted the problem. Many teams use both. We can feed clean, consistently defined data to an analysis tool if you already have one.

Can staff at one location see another location's data?

Only if their role allows it. Access rules are set per location, so staff see their own site by default and leaders see across sites. We can also limit sensitive fields, such as pay or customer details, to specific roles. We test those rules before launch so the right people see the right things.

Will we have to replace the systems we already use?

Usually not. We pull data from your existing systems where the vendor's APIs or integration options allow, and build the screens and views around them. If a system cannot share data in a useful way, we explain the options plainly, including keeping it in place and entering a small amount of information twice.

How do you get teams to actually use a new dashboard?

By building it with them. Staff at a pilot location test working screens during Build and tell us what gets in their way. We remove steps, fix labels and change the order of lists based on how they work. A tool people helped shape is one they are far more likely to open each morning.

Who owns the tools after launch?

You own the code and the data. Definitions and access rules are documented in plain language, so your team can see how every number is calculated. After launch we keep improving based on how people use the tools, which is the Optimize step of our process, and you can take the work elsewhere at any time.

often built together

Internal Tools & Dashboards works best connected

Most teams start with one system and connect the next when they are ready. These are the services most often built alongside internal tools & dashboards, on the same record.

All services →
built by our team

See the pattern in a real system

Recruiting, training, contracts and commissions in one sales platform, where a signed and paid deal starts delivery.

All highlighted work →
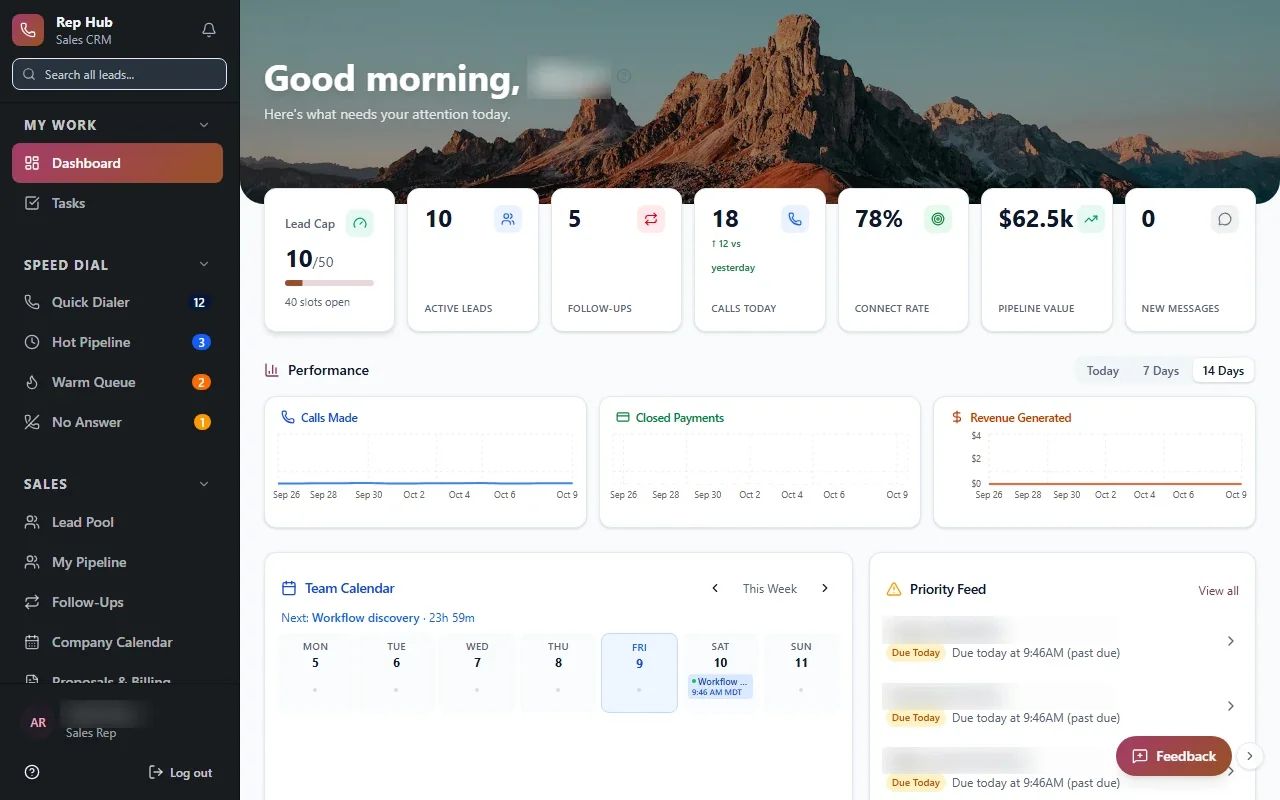
Rep HubRep Hub sales dashboard with lead pipeline, team performance, calendar and tasks Built · Sales organizationRep HubFrom joining the sales team to delivering the sale, in one connected platform.View the project →

Start with the problem. We'll build the possibility.

Tell us what slows your team down. We'll map it with you and suggest a useful first release, whether you're in Dallas or anywhere in Dallas–Fort Worth.