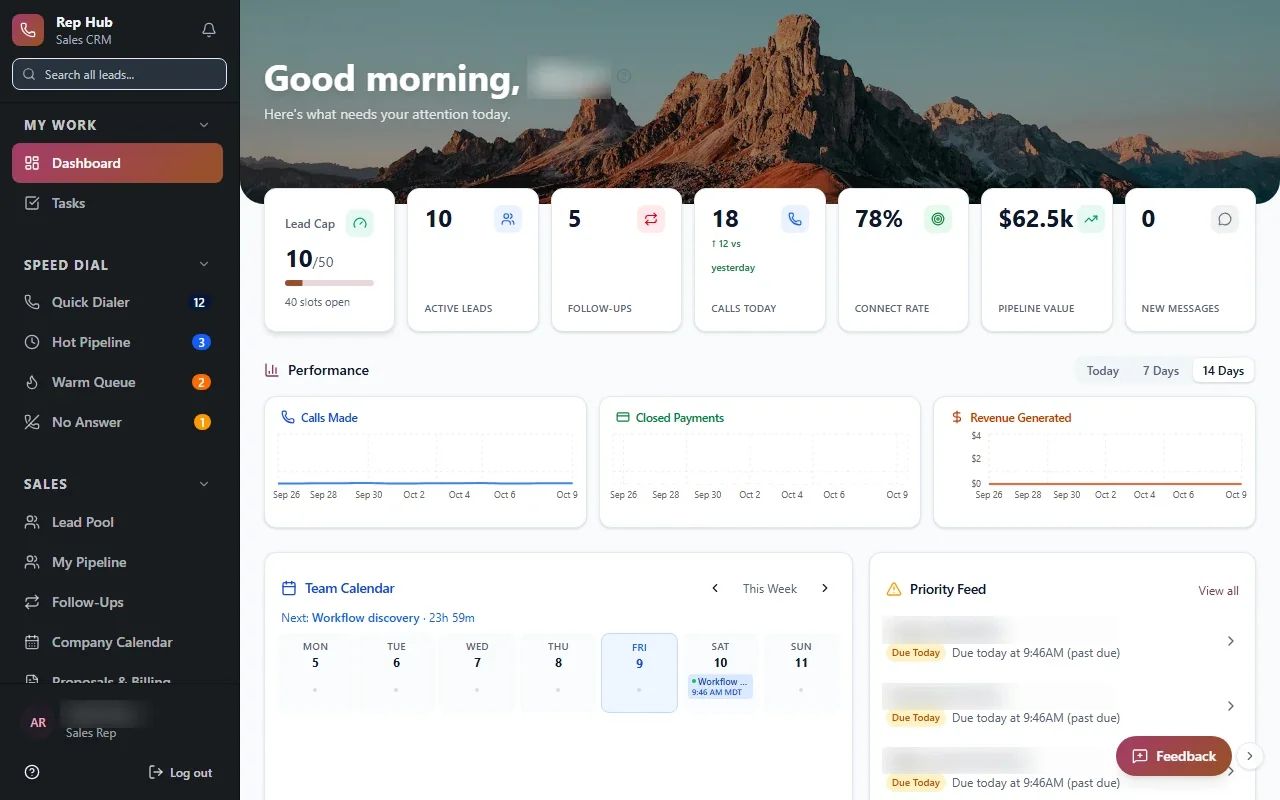
Managers stop rebuilding reports by hand, and the Monday meeting starts with the same numbers on every screen.
Definitions first
We write down what counts as a lead, a qualified opportunity, a stage change and a win, and who owns each definition.
- Lead and qualified opportunity
- Stage entry and exit
- Win, loss and no decision
- Activities that count
Pipeline, activity and conversion
Pipeline by rep, stage, source and close month, with changes since last week, plus stage-to-stage conversion that shows where deals slow down.
- 1 Data collected
- 2 Definitions applied
- 3 Dashboard refreshed
- 4 Manager reviews
- 5 Actions assigned
A forecast you can trace
The forecast is weighted from your own stage history, and every number opens the deals behind it.
TodayWith sales dashboards & forecasting
✕Reports rebuilt from exports
✓Dashboards on schedule
✕Teams report different numbers
✓Shared definitions
✕Forecast by gut feel
✓Forecast from stage history
Connected to your tools
CRM, phone system, spreadsheets and billing, connected where they allow it, with weekly summaries by email.
The system handles
- Refreshing dashboards
- Tracking stage changes
- Sending weekly summaries
Your people decide
- Forecast calls
- Coaching reps
- Setting targets